Food Hygiene:
Know The Score

2019 REPORT

Understand what food hygiene ratings mean to customers and businesses and see how your region, town or city compares nationally.

As an online training provider who has certified over 450,000 people in food hygiene, we’re committed to making food safety awareness more accessible for those who need it. With this in mind, we investigated food hygiene and safety standards across the UK.

To find an average rating for every major town and city, we extracted Food Standards Agency (FSA) data for a quarter of a million food businesses across the country. Above all, we wanted to learn more about what the scores mean and, ultimately, why food hygiene ratings matter.

Our findings should give you a comprehensive understanding of why your local food businesses gain the ratings they do, which will help you make more informed decisions about where to eat or how to gain a good score in your establishment.

How does your local area compare with others?

Use our interactive map and tables to see where you sit in the rankings. Click each region on the map for more detail.

Loading ...
back
South West
East Counties
London
Wales
South East
North West
North East
West Midlands
East Midlands
Northern Ireland
Scotland
Yorkshire & Humber

Overall Results

You can filter these results by Region or by Town / City:

North East

Ranked #5 of 11

Yorkshire & Humber

Ranked #6 of 11

South West

Ranked #2 of 11

Wales

Ranked #7 of 11

East Counties

Ranked #5 of 11

East Midlands

Ranked #3 of 11

London

Ranked #11 of 11

North West

Ranked #8 of 11

Northern Ireland

Ranked #1 of 11

Scotland

Scotland uses a different rating system to the rest of the UK which has two main ratings - 'Pass' or 'Improvement Required'. We have provided the percentage pass rates by local authority below.

South East

Ranked #4 of 11

West Midlands

Ranked #9 of 11

What is the Food Hygiene Rating Scheme?

The Food Hygiene Rating Scheme (FHRS) is a partnership with local authorities in England, Wales & Northern Ireland. It exists to give customers a general idea of how well a premises upholds food hygiene standards.

An Environmental Health Officer (EHO) from the town or city’s local authority visits the business at a frequency between every six months and two years, depending on the level of ‘risk’ the business presents. For example, a restaurant that constantly prepares and handles food is considered higher risk than, say, a newsagent where food is mostly pre-packaged.

The EHO conducts an inspection of an establishment to ensure the business complies with food safety regulations and gives a rating based on their findings. The criteria and rating scale are summarised below.

What makes up a rating?

Illustration of hot food in hand

Hygienic food handling

The preparation and cooking of food and how it is subsequently reheated and cooled. Storage of food is also considered in this part of the inspection.

Illustration of building with food counter

Physical condition of the
premises & facilities

Whether it has an appropriate layout, adequate lighting, a high standard of cleanliness, suitable ventilation & pest control.

Illustration of HACCP clip board

Food safety management

Evidence that the business is taking suitable precautions to keep food safe. This can include HACCP systems, staff training records and logs of relevant checks.

These 3 elements make up the overall food hygiene rating which is scored out of 5 as follows:

These ratings are then made available on the Food Standards Agency (FSA) website and are usually visible from outside of the premises, often presented in a window near the entrance. You may recognise the sticker from restaurants, cafes & pubs you’ve previously visited.

In Wales and Northern Ireland, it is compulsory for businesses to display their food hygiene rating. However, in England it is currently just considered best practice.

Scotland’s Food Hygiene Information Scheme

A similar scheme operates in Scotland, called the Food Hygiene Information Scheme (FHIS). After an EHO has reviewed the safety systems in place, observed food hygiene in practice and spoken with the staff, the businesses are given either:

Scotland Scheme Pass Image
‘Pass’ - meaning they meet the legal standard of food hygiene.

Or

Scotland Scheme Improve Image
‘Improvement Required’ - meaning the legal standard of food hygiene was not evident during the inspection. The business will need to improve certain areas to then qualify for a pass.
Illustration of Scotland with Landmarks

Our Key Findings

Here are our highlights. For details of the analysis that lead to these insights please see our full approach in the methodology. Do any of these surprise you? Share your favourites and tag us in your tweets @hst.


top cities illustration

Top 3 Overall Towns & Cities

1 Harrogate 4.85
2 Hastings 4.82
3 Southport 4.76
I’m delighted to hear that the Harrogate district has topped the list for the highest average food hygiene ratings...

This recognition is testament to the hard work of our officers who ensure that hygiene standards in food businesses remains consistently high. The district is fortunate to have many long established and successful businesses which the council has worked with through a business forum to help them improve. We also secured a Food Standards Agency grant to help small businesses meet new legal requirements relating to food safety systems back in 2004. The work done back then created the bedrock for our current success. Well done to all involved.

Image of Councillor Mike Chambers
Councillor Mike Chambers Harrogate Borough Council’s cabinet member for housing and safer communities
top regions illustration

Top 3 Overall Regions

1 Northern Ireland 4.59
2 South West 4.54
3 East Midlands 4.49
top 1000 establishements illustration

Top 3 Large Cities (Over 1,000 Establishments)

1 Nottingham 4.54
2 Belfast 4.48
3 Newcastle upon Tyne 4.42


Findings By Region

Our team have put together key insights from each region. Scroll through the regions and see how your area compares to your neighbours.

East Counties Icon

East Counties

  • Ipswich and Colchester are top of the East Counties rankings with a joint average rating of 4.67.
  • Luton is bottom of the East Counties rankings with an average rating of 3.78.
  • 1 in 10 businesses in Luton require improvement in the cleanliness and condition of their facilities and buildings.
  • Ipswich’s average rating is higher than Norwich and is one of only two places in England, Wales, and Northern Ireland to actually improve its average rating in the most recent 2018/19 inspections (increasing to 4.72).
East Midlands icon

East Midlands

  • Lincoln is top of the East Midlands rankings with an average rating of 4.54.
  • Mansfield is bottom of the East Midlands rankings with an average rating of 4.11.
  • No region in the East Midlands has a lower average rating than 4 overall.
  • On average, only 10% of the 1,440 food businesses in Leicester score a 5 across all three areas of the FHRS.
London icon

London

  • City of London Corporation is top of the London rankings with an average rating of 4.55.
  • Barking and Dagenham is bottom of the London rankings with an average rating of 3.43. It also has the lowest number of establishments in London (398).
  • Westminster’s average rating of 4.16 comes from over 3,000 establishments.
North East icon

North East

  • Hartlepool is top of the North East rankings with an average rating of 4.70.
  • South Shields is bottom of the North East rankings with an average rating of 4.24.
  • No town or city in the North East has a lower average rating than 4 overall.
  • Durham would be bottom of the rankings with an average rating of 4.04 if the analysis only considered premises inspected in 2018/19.
  • Newcastle win the Tyne-Wear derby over Sunderland with an overall average rating of 4.42 vs 4.28.
  • In Sunderland, just over 5% of the 566 food businesses inspected overall have ‘Very Good’ Management of Food Safety.
  • Middlesbrough have had a similar number of establishments inspected to Sunderland, yet have over 42% in the ‘Very Good’ Management of Food Safety category.
North West icon

North West

  • Southport is top of the North West rankings with an average rating of 4.76. It is also 3rd in the overall rankings.
  • Bolton is bottom of the North West rankings with an average rating of 3.83.
  • When looking at towns and cities with over 1,000 establishments, Manchester has the second lowest rating with an average rating of 4.08.
  • Manchester beats Liverpool on average ratings with 4.08 vs 4.06, but loses when looking only at premises inspected in 2018/19 (3.60 vs 3.84)
  • Blackpool has 1,393 establishments and an average rating of 4.35, despite being 3rd from the bottom in UK’s Unhealthiest High Streets report.
Northern Ireland icon

Northern Ireland

  • Newry, Mourne & Down and Causeway Coast & Glens are top of the Northern Ireland rankings with a joint average rating of 4.71.
  • Antrim & Newtonabbey is bottom of the Northern Ireland rankings with an average rating of 4.44.
  • However, the gap between the top two locations and Antrim & Newtonabbey is only 0.27 which is the smallest difference between the highest and lowest ratings in any region.
  • At the time of this report, only 1 establishment in the whole of Northern Ireland has a published rating of 0.
  • No region in Northern Ireland has a lower average rating than 4.
  • Belfast has the second highest average rating in the whole of the UK when compared with other larger towns and cities (with over 1,000 establishments).
Scotland icon

Scotland

  • Orkney Islands has the highest pass rate of 100%.
  • Aberdeen City has the lowest average pass rate of 74.35%.
  • Shetland Islands has a total of 95 establishments with published ratings and 23 are rated as ‘Improvement Required’.
  • South Ayrshire has 705 establishments and only 1 is rated as ‘Improvement Needed’.
South East icon

South East

  • Hastings is top of the South East rankings with an average rating of 4.82. 94% of establishments scored a rating of either ‘Good’ or ‘Very Good’ in Management of Food Safety.
  • Slough is bottom of the South East rankings with an average rating of 3.86. Over 10% of food businesses fell into the category of requiring ‘Major Improvement’ or more in the management of food safety.
  • Despite both Slough and Hastings having a similar number of establishments inspected, their average ratings differ by nearly a full rating point.
South West icon

South West

  • Wells is top of the South West Rankings with an average rating of 4.72.
  • However, Wells had 58 establishments inspected which is the least across all the towns and cities in this report.
  • Weston-Super-Mare is bottom of the South West rankings with an average rating of 4.20. However, 249 establishments were inspected which is just over 4 times more establishments than in Wells.
  • None of the South West towns analysed within this study have an average rating lower than a 4.
  • Bristol is the only town or city with over 1,000 establishments to have over a 60% inspection rate in 2018/19 (1,190 establishments inspected).
Wales icon

Wales

  • Gwynedd & Conwy are top of the Wales rankings with a joint average rating of 4.75.
  • Rhondda Cynon Taf and Merthyr Tydfil are bottom of the Wales rankings with a joint average rating of 3.89.
  • 95% of food businesses in Conwy have a rating of 4 or higher.
  • 10% of food businesses in Blaenau Gwent have a rating of 2 or lower.
West Midlands icon

West Midlands

  • Shrewsbury is top of the West Midlands rankings, with an average rating of 4.66.
  • Walsall is bottom of the West Midlands rankings, with an average rating of 3.68.
  • Birmingham has the most establishments outside of London (2,645 establishments). 1 in 5 have a rating of 2 or lower.
  • Burton upon Trent had the lowest inspection rate of 29.90% of any town or city for inspections conducted in 2018/19.
Yorkshire icon

Yorkshire and Humber

  • Harrogate is top of the Yorkshire and Humber rankings and also top of the overall rankings with an average rating of 4.85.
  • Huddersfield is bottom of the Yorkshire and Humber rankings, with an average rating of 4.09. Nowhere in Yorkshire & the Humber has an average rating lower than 4 overall.
  • Grimsby is second in the Yorkshire and Humber rankings with an average rating of 4.62, despite being bottom of UK’s Unhealthiest High Streets report.
  • In Scunthorpe, 1 in 11 businesses need improvement of their ‘hygienic handling of food’. This is the highest proportion of businesses in Yorkshire.
  • Halifax, Rotherham, Scunthorpe, Bradford and Huddersfield all drop below an average 4 rating when looking only at premises inspected in 2018/19.
  • Leeds is one of the biggest cities in the country, but only 559 premises had published inspections in 2018/19, just 30.94% of the overall number of establishments.

What does this mean?

For Businesses

Pizzas being cooked in restaurant oven

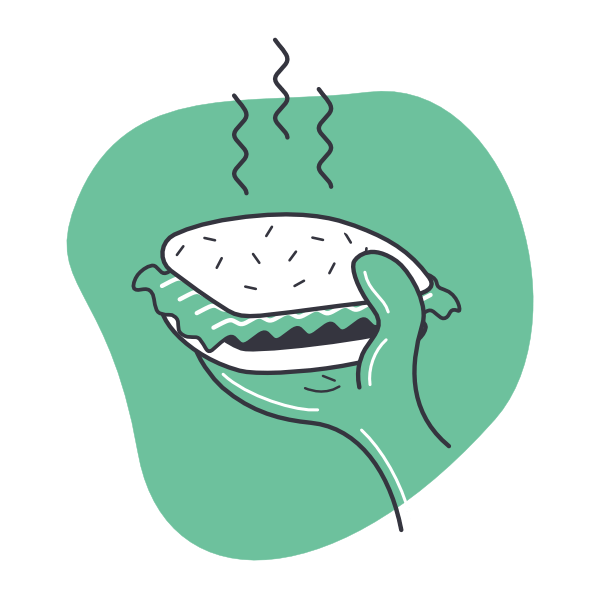
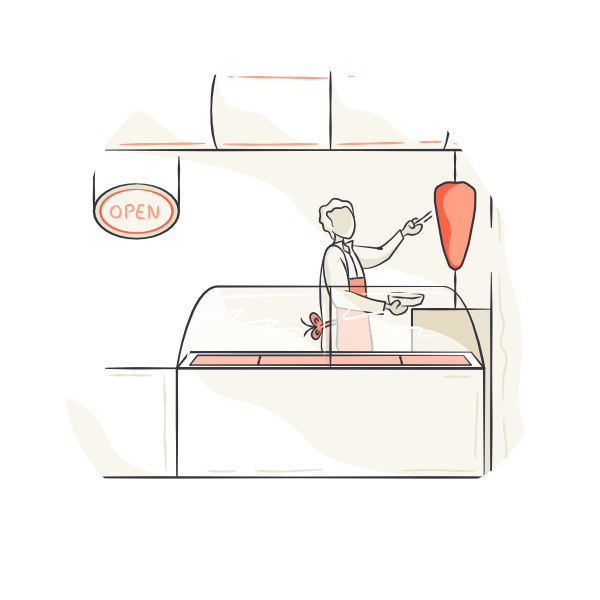
Your Customers Care About Food Hygiene Ratings

Businesses should pay close attention to their food hygiene rating. As more and more customers recognise the sticker, it can have a significant impact on your reputation and profit. Customers may decide to go elsewhere and may avoid recommending you to others.

In a survey on why customers wouldn’t return to a restaurant, 57% of 1,000 respondents cited ‘a low food hygiene rating’ – more than those who responded with rude staff and slow service.

As displaying the rating is not compulsory in England, 49% of businesses choose not to do so. However, for 59% of consumers, this could translate to the premises having a poor hygiene standard, even if it doesn’t. The FSA actively encourage marketing a good rating to attract customers. Social media could be a particularly effective way of doing so, especially considering 1 in 5 people in the UK take to online platforms to decide on their chosen eatery.

Illustration of hotel scene

One Poor Inspection Can Damage Your Business

One potential limitation of the scheme is the fact that an inspection is essentially a “snapshot” of the business, meaning the rating may not be wholly reflective of day-to-day running. Even Michelin starred restaurants can have a bad day, as the popular London eatery Dabbous discovered. The restaurant was awarded a rating of zero on one particular inspection, after EHOs discovered an infestation of mice. Fortunately, they were able to prove this was not reflective of their usual standards and, on a subsequent inspection, Dabbous was awarded a five.

It can take up to six months for premises to be re-visited following an unsatisfactory rating. It can take a further 28 days for the rating change itself to be reflected publicly. This explains why there may be a discrepancy between a rating online and one displayed on a building. As a result, businesses could be losing customers despite having improved their standards since the last inspection.

If you want to make sure you are fully prepared for an EHO inspection download our free inspection checklist.

Food Hygiene isn’t just about “Food Hygiene”

The term ‘Food Hygiene’ is often purely associated with how hygienically food is handled and prepared. As we’ve discussed, the FHRS comprises of more than this and each area is equally important to your overall food hygiene rating.

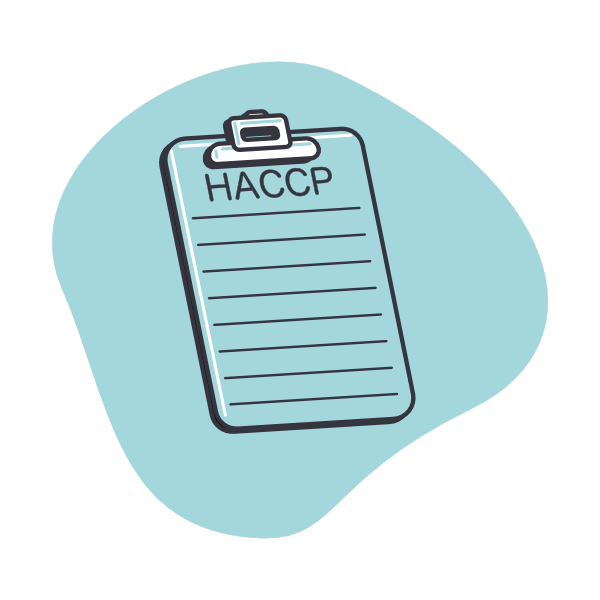
Issues with your management of food safety can significantly affect your food hygiene rating. This is why you must demonstrate appropriate HACCP Systems, staff training records, and the knowledge and capability of the manager.

We spoke to Eilidh Paton, owner of Alba Food Safety Consultancy and a Chartered Environmental Health Officer in Glasgow:

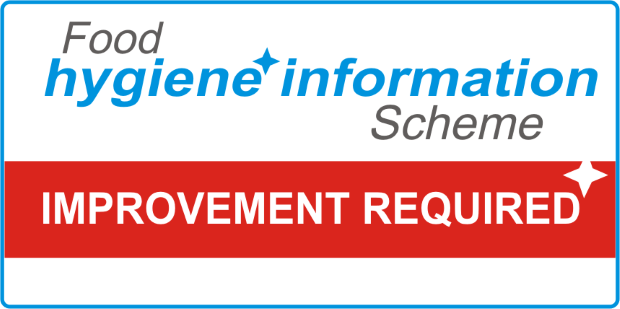
The scheme does require that we mark a premises as ‘improvement required’ if they have a repeat contravention from the previous inspection, which may be as little as a maintenance issue e.g. cracked tiles, which is a very trivial matter overall.
Image of Eilidh Paton
Eilidh Paton Alba Food Safety Consultancy

This could mean diners are put off a restaurant, unaware that the rating was given as a result of the building condition, as opposed to physical handling and cleanliness of food.

This is why, in order to obtain a good food hygiene rating, it’s crucial to make sure you get each of these areas right.

If you are looking for the knowledge and skills needed to manage your food business correctly then check out our online Level 3 Food Hygiene Course. It covers everything you need to know to ensure a food business is operating hygienically including contamination control, waste management and HACCP.

You Can’t Hide Your Food Hygiene Rating

Even if you choose not to display a lower rating, customers can still find it elsewhere. The Food Hygiene Ratings Information website is visited over 250,000 times a month, showing that there is real public interest in hygiene ratings. Similarly, food hygiene rating app Scores on the Doors is just one of many apps available in the UK and has been downloaded over 50,000 times from Google Play alone.

Just Eat, the popular takeaway food delivery service, announced in February 2019 that any zero-rated restaurants listed on the Just Eat platform would have until 1st May 2019 to improve their hygiene rating or they would be removed.

Illustration of food rating on a computer

Also, any restaurants seeking to sign up to Just Eat would be required to have a minimum food hygiene rating of 3 or be registered with the FSA and awaiting inspection. In the same announcement, Just Eat explained plans to monitor food hygiene ratings of establishments by updating their system to use FSA data. This would mean that Just Eat would automatically be notified if a restaurant on their platform falls below a hygiene rating of 3. The steps Just Eat have taken emphasises again that food hygiene ratings are constantly being checked, not just by consumers, but also by other businesses.

Faking Your Food Hygiene Rating Isn’t Worth It

In 2018, the BBC exposed a number of establishments who were displaying a falsely high rating. Doing so is considered a fraudulent crime and can carry heavy consequences, as an Islington cafe learned when they were fined £2,500.

In Derby, a restaurant owner received a 5 year ban from running companies after displaying an incorrect rating. The business was forced to pay total fines of up to £9,000, highlighting that the cost of falsely advertising a rating is too high.

Although the infrequency of inspections may make it difficult to police this, it is becoming easier for customers to check the rating on the door against those held online by the FSA. Combine the fine with the inevitable bad press and reputational damage, faking a rating simply isn’t worth the risk to your business.

If you feel as though a recent inspection hasn't reflected your usual standards, use our guide to find out how to appeal your food hygiene rating.

For Customers

Group of people in a bar

It’s Still Down To You To Check Food Hygiene Ratings

Although food businesses have a legal duty to run their business hygienically, customers should always check a business’s hygiene rating if they want to minimise the risk of eating at an unsafe establishment.

[Speaking about customers in Scotland] Overall, I believe that the public should educate themselves on a business’s rating as those that are ‘improvement required’ are generally not operating according to the law.
Image of Eilidh Paton
Eilidh Paton Alba Food Safety Consultancy

There have been calls from the Local Government Association (LGA) for England to follow Northern Ireland and Wales in making it mandatory for businesses to display their ratings. 60% of people learn about the hygiene standards of a premises through the stickers they display, so it seems fair to say that an increased visibility of hygiene ratings will help customers make safe choices.

Not sure about the rating in the window? You can check individual food hygiene ratings using the Food Standards Agency’s information or by downloading the Scores on the Doors app on your mobile. Just put in the name of place you want to check or enter your postcode to check the businesses in your local area.

Takeaways Are The Biggest Offenders

According to our data, more than 1 in every 9 takeaways and sandwich shops in England, Wales, and Northern Ireland have a hygiene rating of 2 or lower. With figures showing there are more takeaways on our high streets than ever before, this statistic could be real cause for concern.

When it comes to premises that require ‘major’ or ‘urgent’ improvement (a rating of one or lower), takeaways stand out as a problem area. Almost 7% of takeaways and sandwich shops across England, Northern Ireland, and Wales fall into this bracket. In contrast, little over 1% of hotels, bed and breakfasts, and guest houses hold a hygiene rating of less than two.

Scene of a takeaway

Scotland is a similar situation to the rest of the UK. Over 20% of its takeaways and sandwich shops are rated as ‘Improvement Required’. The risks posed by food establishments operating in this way are concerning, Eilidh Paton says.

If a food business operator does not implement the basic rules of operating a food business correctly then it’s likely they will generally not apply the correct rules to any of their business e.g. cross contamination controls, temperature controls, which is of great concern to me as an EHO.
Image of Eilidh Paton
Eilidh Paton Alba Food Safety Consultancy

By preventing the worst offenders from appearing on their platform, Just Eat have echoed this sentiment.

Good Food Hygiene Doesn’t Always Mean Good Food

There are also areas outside the scope of the FHRS, such as the quality of food and skill of the chef making it. Michelin-starred restaurants have commented that the scheme actually lends itself more toward chain food outlets, as they don’t have a constant supply of fresh food entering the premises and have less flexible menus.

Chain stores are also more likely to have office-based headquarters who can focus on making health and safety practices uniform across the stores, simplifying processes and making this easier to achieve for all staff members.

The LGA have called for healthier food options to form part of the ratings criteria, which could significantly affect the inspections process and, ultimately, where diners choose to eat.

Illustration of restaurant scene

Food Hygiene Standards Are Not The Same Everywhere

From our report, it would seem there are parts of the country where customers can dine in confidence when it comes to hygiene standards. Those in Harrogate, for example, can assume an establishment will have a high standard of food hygiene as, on average, the Yorkshire town is just shy of the highest possible rating. The risk of standards slipping is higher for those in Walsall, Birmingham and Luton as their average ratings are some of the lowest in the UK.

Similarly, customers in Northern Ireland or Wales are more likely to experience higher food hygiene standards. There is however a relatively small difference between the countries and it would be interesting to see how this would change if England were legally required to display their ratings.

Premises in Scotland are also not obliged to display their ratings. If a two or lower rating in the FHRS is considered the equivalent of an ‘Improvement Required’ grading in the FHIS, consumers in Scotland are on average more likely to eat somewhere that ‘Requires Improvement’ than anywhere else in the UK.

With over one million food poisoning cases in the UK each year, the dangers posed by businesses operating unhygienically are clear. It’s always best to double check a rating if you are unsure.

Only One Third of the Rating is Based on the Hygienic Handling of Food

There are three individual components that make up a food hygiene rating. Two thirds of the rating consider the building attributes and food safety management systems in place. We reported that 1 in every 15 businesses across England, Wales and Northern Ireland have an overall rating of 2 or lower, suggesting that they required improvement. However, it was only 1 in every 30 businesses where this improvement specifically concerned the physical handling of food.

If your favourite restaurant scores less than a five, it doesn’t necessarily mean they are preparing your food unhygienically. Find the establishment you are concerned about using via the Food Standards Agency’s information and the site will show you how well it scored in each of the three areas. This can give you a better idea of the factors behind the rating, so you can be more confident in somewhere that hasn’t scored a five.

Waiter Clearing a table

What's Next?

Calls for the display of food hygiene ratings to be made mandatory in England and Scotland are not going away. Brexit has been seen as an opportunity for this to be looked at once more but there is currently no legislation tabled.

It has been reported recently that Food Hygiene standards are decreasing. The annual ratings from the 2018/19 inspections seem to echo this concern, with reductions in overall hygiene ratings across all towns and cities besides Ipswich, Burton-Upon-Trent and Winchester.

We noted in the regional analysis that although Grimsby, Blackpool and Wolverhampton are listed among some of the UK’s “Unhealthiest High Streets” , they are all in the UK’s top 40 highest rated places for hygiene and safety standards. There are calls for the FHRS to consider the health offering of a menu as a potential criteria which could significantly alter the way the scheme currently operates.

Our analysis of food hygiene ratings data is just one of many different ways this data can be interpreted. We are always interested in new insights for food hygiene standards. Feel free to use our findings as a starting point in your own further research and please tag us in your discoveries.

Case Studies

Waterstones Cafe Location

In this case study, we look at what food hygiene means to Cafe W at Waterstones and find out how they stay prepared for those all-important EHO visits.

Waterstones Cafe Location

How has online food hygiene training helped family run business Welcome Stranger? Carol & Lester tell us why such high standards are a core value.

Methodology

Data was downloaded on the 25th of January 2019 from the official Food Standards Agency ‘UK food hygiene rating data API’ which details the overall food hygiene ratings, rating components, and inspection results of food establishments across the UK.

The Food Standards Agency data attributes each establishment with one of fourteen business types. Of these business types, four were selected for inclusion. These were:

  • Restaurants/Cafes/Canteens
  • Takeaways/Sandwich Shops
  • Pubs/Bars/Nightclubs
  • Hotels/Bed & Breakfasts/Guest Houses

After filtering, if a business did not have a current rating or an inspection result then the entry was omitted from the analysis.

This resulted in a filtered total of businesses, equalling 239,783 establishments that fell within these categories and which were then used for the overall ranking analysis.

The regions selected for analysis in this report are the same twelve regions as used by the Food Standards Agency, and so businesses were split according to the region associated with their business.

The cities and towns being compared were selected from records held by the Office for National Statistics and the National Archives.

To match the food hygiene ratings provided for businesses by the Food Standards Agency we performed postcode lookups through the use of an online database, allowing us to match the postcodes of businesses with their closest major city or town, and the major city or town with their region. If a business did not have a valid postcode, then the entry was omitted from our analysis.

Following this, we amalgamated the food hygiene ratings of each town and city to provide an aggregate rating of food hygiene ratings for an area.

Following the data download, and after cities and towns were matched to rated businesses by postcode, several steps were taken to ensure the data was clean and fit for purpose.

In several instances, to ensure that the data was of interest to certain regions, the local authorities (as defined by the Food Standards Agency) of a region were used to split a region into further areas instead of using a city/town split. However, to provide clarity, in the overall rankings only cities and towns are listed.

As mentioned above, entries in the data downloaded from the Food Standards Agency without a valid postcode were omitted from analysis.

Also notably, the local authority of Rochford was omitted after it was discovered that no appropriate business category information was provided and so analysis could not be conducted.

Following the cleaning of the data, several lists were created with cities/towns in each region ranked according to their mean food hygiene ratings and then subsequently ranked according to their overall rank in the UK - leading to the lists you are presented with here.

We also considered 2018/19 inspection data in isolation to see if there were any differences in average ratings. We took the number of inspections that were carried out in 2018/19 and calculated an inspection rate from this data.

Food Standards Agency food hygiene ratings information, data and services is subject to the terms of the Open Government Licence (OGL).

The ratings are subject to change as they are regularly updated to reflect the standards found when a business is inspected by a local authority food safety officer.

Our study contains public sector information licensed under the Open Government Licence v3.0.

High Speed Training would like to thank the Food Standards Agency, the Office for National Statistics, the National Archives and Chris Bell for providing the data needed to accomplish this study. We’d also like to thank Becky Oljanuk, Zoe Outram and Akilah Manneh at Waterstones and James Sherwood at Harrogate Borough Council.

Finally we would like to extend special thanks to Eilidh Paton at Alba Consultancy for supporting us with this study.

Full press release for this study is available here: Press Release

High-res illustrations and infographics available for use here: Press Pack

For more information or additional quotes, please contact Lee Batchelor from the data team. Email lee.batchelor@highspeedtraining.co.uk or call 01943 811 436.

Like This Article?
Share it on social.