


Your role in food safety
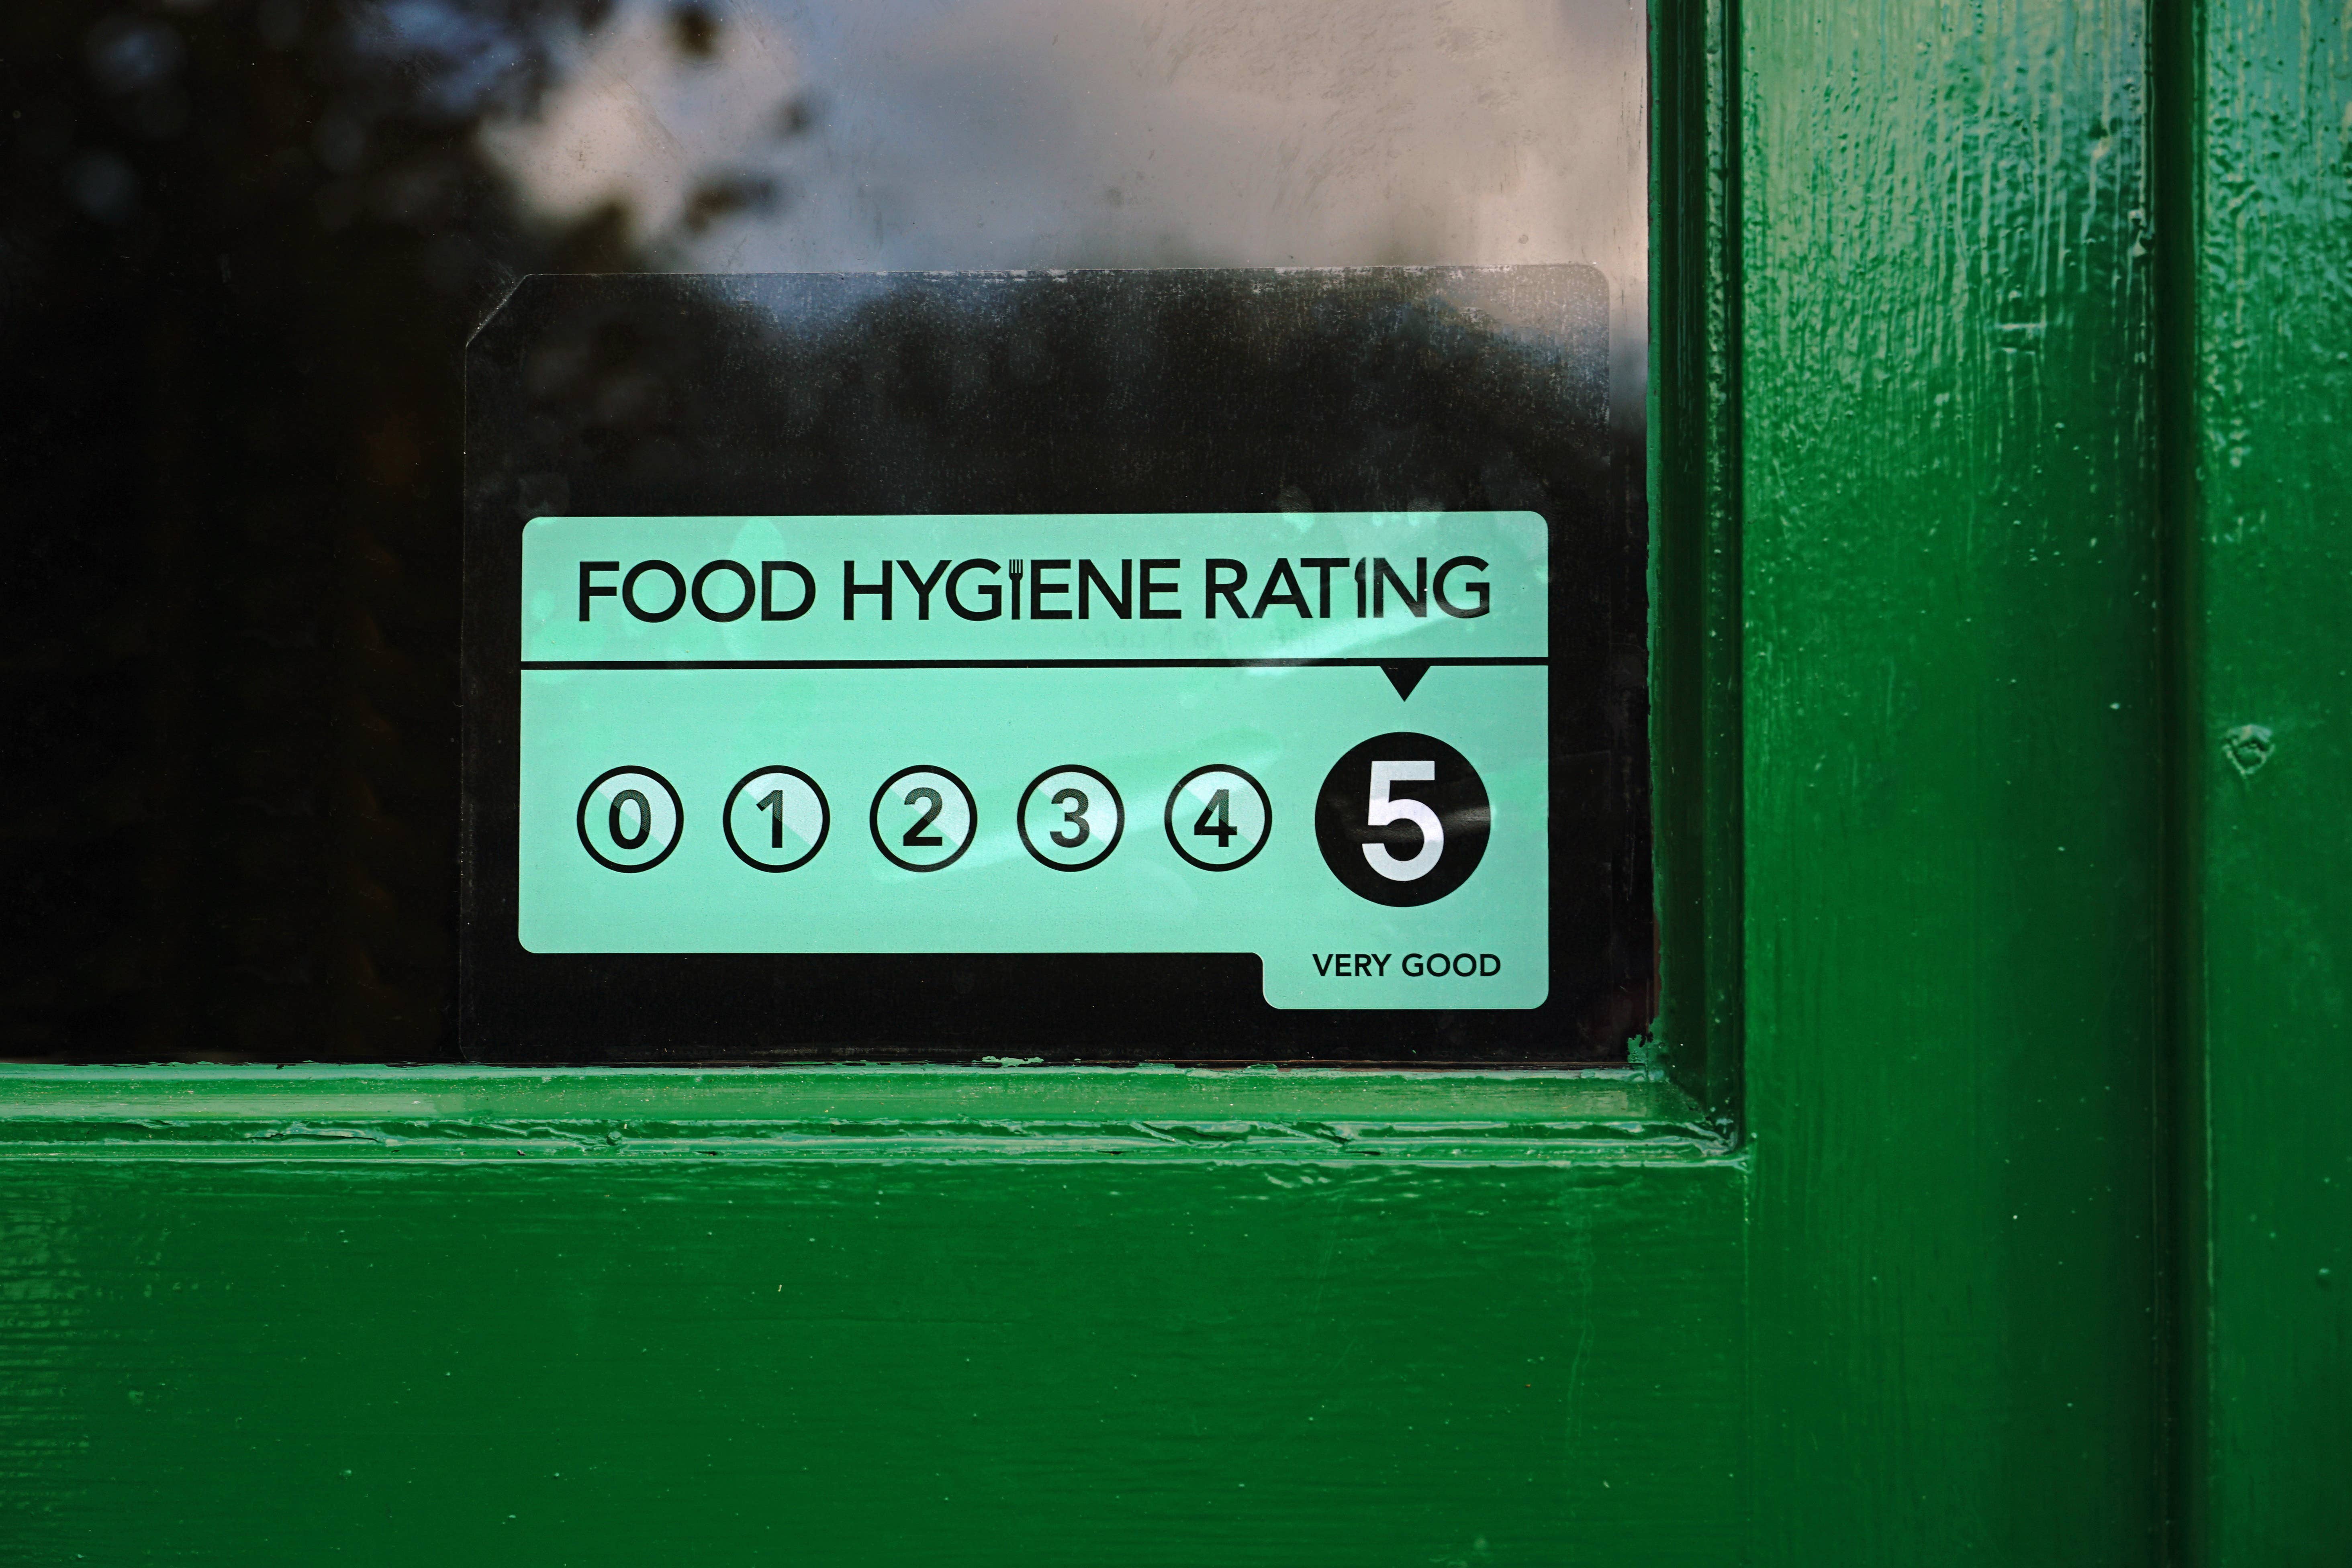
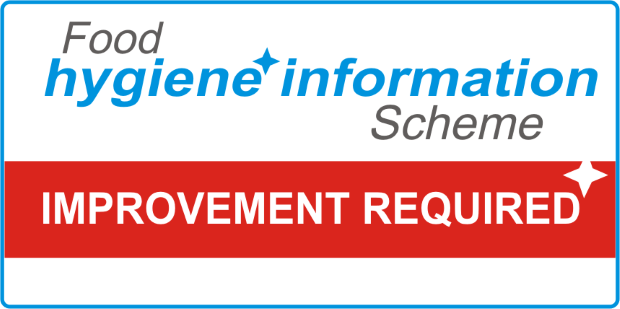
While it's a legal duty for food businesses to operate hygienically, checking these ratings to ensure that the premises are maintaining good standards of hygiene remains the responsibility of the consumer. Fortunately, checking ratings is straightforward - you can easily check online via the FSA website, and some businesses display their rating in-store.
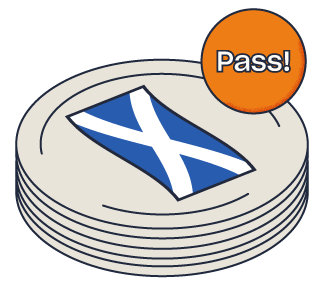
However, in England, businesses are not legally required to display ratings, unlike Northern Ireland and Wales. The FSA's 2024 audit found that 28% of establishments in England chose not to display their rating, contrasting sharply with NI (9%) and Wales (7%). Notably, businesses with a top rating of 5 were far more likely to display their sticker (82%) compared to lower-rated ones. This highlights the importance of staying informed and checking food hygiene ratings online as the information may not always be readily available in person.